I've been doing a lot of data analysis in JavaScript. It makes sense for me to work in JavaScript, because I already use it and that's where my visualizations normally end up. JavaScript has a very rich ecosystem of visualization libraries so that's not surprising. All these visualization libraries are browser based... which is great if that's where you want your visualization to be. It's not so great if you just want to render a chart to an image, say to store for later or to include in some kind of report.
I wanted to be able to render charts from the command line. I wanted to be able to render charts from a headless server. There seems to be no charting or plotting library that supports this directly. We can however approach this indirectly and in this blog post I'll show you how to render charts from Node.js. It's not as easy or convenient as I'd like but is possible using a browser visualization library coupled with a headless browser.
Please read on to learn how I render charts and other visualizations using C3 and Nightmare.

Getting the code
You can find an example to accompany this blog post on Github. Click here for the repo. This repo contains some sample data, a chart definition, and two example uses of c3-chart-maker: one example that shows how to use it from the command line and another that shows how to use it from code.
c3-chart-maker is a command line app and API that wraps C3 and Nightmare and easily allows you to create charts in Node.js. You can find c3-chart-maker on Github here.
For Patrons I'll be happy to supply a more specific or customized code example If you need it, please just ask.
Please make sure you have Node.js installed before following along.
c3-chart-maker
c3-chart-maker is an app and a JavaScript API that you can install via npm (the node package manager).
You can use it to render charts from an input CSV data file and a C3 chart definition. To render charts it uses C3 and Nightmare.
C3 is an awesome charting library. It provides a range of charts and is built on the ubiquitous visualization library that is D3. C3 trades off some of D3's power and flexiblity for convenience, ease of use and set of pre-made configurable chart types. I chose C3 because most useful charts that I needed can be created quickly from it's JSON chart definition. To see what C3 can do take a look at the example gallery.
Nightmare is a high-level browser automation library. This is our headless browser. Nightmare is an API over Electron, it works out of the box with Node.js (unlike some of the other headless browsers) and it's pretty easy to get started with.
I'll explain how the code behind this works soon, for the moment I'll show you how you can use c3-chart-maker to generate a chart.
Use case
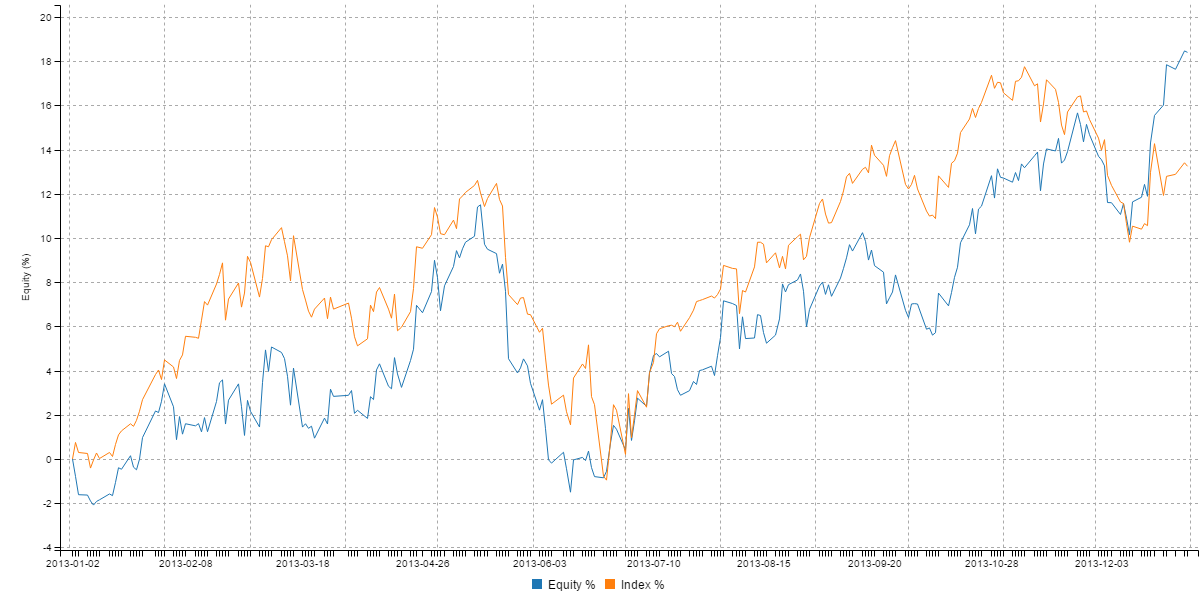
Let's say that we have some statistics on the performance of a stock trading strategy and we want to render this as a chart. This kind of chart is called an equity curve:

The Github repo contains some sample input data, you will find the CSV file example-data.csv in the data sub-directory. This data is output from a backtest that I ran for a particular trading strategy, it should look something like this:
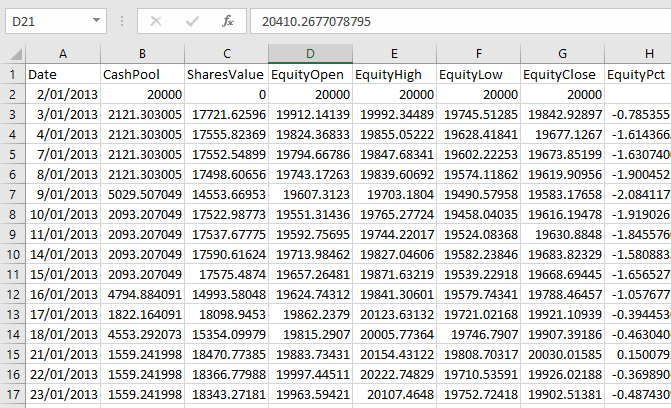
We are going to pull the EquityPct and ComparisonIndexPct columns out of this CSV file and graph them so that we can compare the trading strategy's equity curve to a comparison index (in this case the S&P ASX 200).
We'll now look at the two ways to use c3-chart-maker to render the equity curve chart from this data. First we'll look at how to use it from the command line (no coding required) then we'll look at how to use it as an API from JavaScript code.
Command line usage:
You can run c3-chart-maker directly from the command line. First you must install it globally as follows:
npm install -g c3-chart-makerInstallation can take some time, it comes with an entire headless browser which is quite large!
In the Github repo you will find a batch file call gen-example-chart.bat that shows the command line for c3-chart-maker to generate the equity curve chart. You can run the batch file or you can type the command manually into your command prompt to run it.
Chart definition file
Somehow we need to define the look of the graph and which data it uses. This is where the chart definition comes into play. equity.json in the charts sub-directory contains the chart definition for the equity curve comparison chart, it looks like this:
{
    "size": {
        "height": 600,
        "width": 1200
    },
    "series": {
        "x": "Date",
        "Equity %": "EquityPct",
        "Index %": "ComparisonIndexPct"
    },
    "data": {
        "x": "x",
        "type": "line"
    },
    "axis": {
        "x": {
            "type": "timeseries",
            "tick": {
                "format": "%Y-%m-%d"
            }
        },
        "y": {
            "label": {
                "text": "Equity (%)",
                "position": "outer-middle"
            }
        }
    },
    "grid": {
        "x": {
            "show": true
        },
        "y": {
            "show": true
        }
    },
    "point": {
        "show": false
    }
}
This is almost a standard C3 chart definition. I won't go into detail because you will find substantial documentation on the C3 website.
I do want to point out one thing though. Note the series sub-section in the chart definition. This defines the mapping of CSV columns to series that are rendered in the C3 chart. You can can read it like this:
- The x axis is taken from the Date column.
- The other mappings here are for the y axis:
- The series Equity % is mapped to the column EquityPct.
- The series Index % is mapped to the column ComparisonIndexPct.
c3-chart-maker reads the series sub-section, extracts the necessary columns from the CSV file and then automatically expands the data sub-section.
You can also put inline data into the data sub-section as you would with any C3 chart definition, for example as is done in the line chart example.
Generating the chart
We have some input data in a CSV file. We have spec'd out our chart definition. Now it's time to actually generate the chart. Assuming we have globally installed c3-chart-maker as was shown earlier, we can run the following command:
c3-chart-maker ./data/example_data.csv --chart=./charts/equity.json --out=./output/equity.pngThe first argument is the name of the input CSV file. The --chart argument specifies the JSON file that contains the chart definition. Finally the --out parameter specifies the name of the image file where we want the chart to be rendered.
Run this command and your chart will be rendered as follows:
JavaScript usage:
The Github repo that accompanies this post also contains an example of using c3-chart-maker from JavaScript code. Why use it this way? Well I use it in my personal backtesting software to automatically generate charts based on the data from the backtest. You can use it in any way you want: embed chart rendering in your own command line app or server application.
To use c3-chart-maker as an API first you must install it in your Node.js project as follows:
npm install --save c3-chart-makerNow with a very small amount of code you can render a chart, here's the code from the example Github repo:
const c3ChartMaker = require('c3-chart-maker');

const inputFilePath = "./data/example-data.csv";
const chartDefinitionFile = "./charts/equity.json";
const outputFilePath = "./output/equity.png";

c3ChartMaker(inputFilePath, chartDefinitionFile, outputFilePath)
    .then(() => {
        console.log('Done');
    })
    .catch(err => {
        console.error(err);
    });
Just as when running c3-chart-maker from the command line, when we run it as an API we must specify an input CSV file and an chart definition. We must also specify the name of the image file that is to be rendered.
How does it work?
Now it's time to understand how this works. If you simply want to render some server side charts from a CSV file, you already have enough to do that. Please read on to learn about how this was implemented and how you can get it running on Linux.
c3-chart-maker uses Nightmare, a headless browser based on Electron, to render the charts. In the past I've used PhantomJS and CasperJS and I've found those to be a bit clunky and heavyweight, not to mention tiresome to work with.
Working with Nightmare and has been a pleasant experience. The API works from Node.js, it feels quite lightweight and is straight-forward to work with. You will jump through some extra hoops to get this working on a headless Linux server, but we'll come back to that soon.
Node.js chart rendering with Nightmare
Let's have a look at how chart rendering with Nightmare actually works. First install Nightmare into your Node.js project:
npm install --save nightmareNow we can instantiate Nightmare, which in turn instantiates the headless browser:
var nightmare = new Nightmare({
    show: false
});
The show option is useful because it allows you to enable the UI for the headless browser. This is great for debugging and to see what the browser is doing whilst we drive it programatically.
We call goto to make the browser navigate to a particular web page. In this case it will suffice to load a HTML page that we have in our file system called chart-template.html:
var url = 'file://' + path.join(__dirname, 'chart-template.html');
nightmare.goto(url);
The HTML for rendering a C3 chart is pretty simple. It includes C3, D3 and has a placeholder element called view. The placeholder element is where our chart will be rendered.
<html>
    <head>
        <link href="lib/c3/c3.css" rel="stylesheet">
        <script src="lib/d3/d3.js" charset="utf-8"></script>
        <script src="lib/c3/c3.js"></script>

    </head>
    <body style="background-color: white;">
        <div id="view"></div>
    </body>
</html>
Before we can generate our chart we need to define the chart. We've already seen an example line chart earlier in this post. Following is a simpler line chart definition that I've copied from the C3 example gallery:
var chartDefinition = {
    data: {
        columns: [
            ['data1', 30, 200, 100, 400, 150, 250],
            ['data2', 50, 20, 10, 40, 15, 25]
        ]
    }
};
To generate the chart we need to execute some code within the headless browser. We must call the function c3.generate and pass in our chart definition.
To run code in the brower we call the evaluate function. We pass through our chart definition and call c3.generate:
nightmare.evaluate(chartDefinition => {
    c3.generate(chartDefinition);
}, chartDefinition);
The amazing thing about this is that we generate the chart definition in Node.js and pass it through to the headless browser. This gives us greate flexibility in setting the data from our Node.js code. Maybe we pulled the data from a CSV file (as c3-chart-maker does) or maybe we pulled it from a database. We can also control all the chart options from our Node.js code. So, that's why this is effectively chart rendering from Node.js, cool huh.
Note that we do have a limitation because we are passing the chart definition in from Node.js. Only JSON data can be passed between Node.js and the headless browser and so this limits the kind chart definition that we can use with C3. For example any of the C3 examples that require JavaScript code in the chart definition won't work, fortunately we can make some impressive charts just using a pure JSON chart definition. You could easily fix this though by generating the chart definition in the browser and only passing through options and data from Node.js that you want to control.
Before we can take a screenshot of the chart displayed in the browser we must wait for the chart to be rendered. This doesn't happen instantaneously, it takes some small amount of time, so we call wait which waits until the chart has been loaded and rendered. We know it's been loaded when an svg element appears in the DOM, so the appearance of the chart's svg element is specifically what we are waiting for:
var selector = '#view svg';
nightmare.wait(selector)
After the wait has completed we should now have a fully rendered chart in the headless browser (which you can see if you enabled the show option mentioned earlier).
The last step is to take a screenshot and output it to a file. Nightmare makes this fairly easy using the screenshot function, but we find we still have one difficulty. If our chart is so big that it is scrolled off the web page and the screenshot will only show part of the chart. To fix this we must determine the full width and height of the page then use the viewport function to ensure the entire page (and therefore the entire chart) is visible.
We have some complex async code coming up now, so please hold onto your hats.
nightmare.evaluate(() => {
        const body = document.querySelector('body');
        return {
            bodyWidth: body.scrollWidth, // Get dimensions of the page.
            bodyHeight: body.scrollHeight,
        };
    })
    .then(rect => {
        return nightmare
            .viewport(rect.bodyWidth, rect.bodyHeight)
            .screenshot(outputFilePath, rect);
    })
    .then(() => {
        return nightmare.end();
    })
    .catch(err => {
        console.error(err);
        return nightmare.end();
    });
After setting the viewport and taking a screenshot of the chart we now call end to complete the process. This ends our Nightmare session and causes all the async code to complete.
Getting it to work under Linux
The code I have showed you so far works ok when developing and testing under Windows, however if you want to run this on a headless Linux server you will run into a problem.
The problem is that a headless Linux server has no framebuffer for rendering graphical applications. Even though we are using a headless web browser it still actually has to render something - otherwise how will we get a screenshot of the chart?
To get the code working on headless Linux we need to use Xvfb which is a virtual framebuffer. This might sound complicated but it isn't and we can use the npm package xvfb to do the heavy lifting for us.
Install xvfb into your Node.js project as follows:
npm install --save xvfbLet's say we have a function renderChart that contains all the chart rendering code we looked at a moment ago. Now we can wrap our renderChart function within the code that starts and stops the virtual framebuffer:
var Xvfb = require('xvfb');

function renderChartOnLinux (chartDefinition) {

    var xvfb = new Xvfb();
    xvfb.startSync(); // Start virtual framebuffer.

    try {
        return renderChart(chartDefinition)
            .then(() => {
                xvfb.stopSync();
            })
            .catch(err => {
                xvfb.stopSync();
                throw err;
            });
    }
    catch (err) {
        xvfb.stopSync();
        throw err;
    }
};
After we have rendered the chart we then stop Xvfb. Note that we also stop it if any error occurred, we then rethrow the error so it can be handled higher in the callstack.
We can now generate charts on headless Linux.
Getting better performance
When you have multiple charts to generate you might find that performance can be somewhat terrible.
We'll fix this as best we can by making sure we reuse the Xvfb and Nightmare instances whilst generating multiple charts.
Say that we have a list of charts to render:
var chartDefinitions = [
    // Definitions for multiple charts.
];
Now we need to hoist instantiation of the Nightmare object up out of renderChart so that we can use it multiple times.
function renderCharts = (chartDefinitions) {
    var nightmare = new Nightmare({
        show: false,
    });

    return chartDefinitions.reduce(
            (prevPromise, chartDefinition) => {
                return prevPromise.then(() => {
                    // Nightmare instance is passed in.
                    return renderChart(chartDefinition, nightmare);
                });
            },
            Promise.resolve()
        )
        .then(() => {
            return nightmare.end();
        });
};
We can reuse Xvfb in the same way.
Handling errors
Don't forget to add some handling for browser logging and errors:
nightmare.on('console', function (type, message) {

    if (type === 'log') {
        console.log('LOG: ' + message);
        return; // Don't bother with logs.
    }

    if (type === 'warn') {
        console.warn('LOG: ' + message);
        return;
    }

    if (type === 'error') {
        throw new Error("Browser JavaScript error: " + message);
    }
});
Most of the time you probably don't need the error handling, but it's obviously very useful when you are running C3 in the browser and it wants to report errors in your chart definition.
Conclusion
In this post we learned about chart rendering in Node.js. You can actually use this technique to bake all sorts of visualisations and reports, it's very useful.
You learned about my c3-chart-maker package on npm and how you can use it to quickly generate a chart from a CSV data file based on a chart definition.
We got further into the details and looked at the code required to instantiate a headless browser through the Nightmare automation API. Then we hit a problem on Linux and had to use Xvfb to create a virtual framebuffer to get it working again. Finally we had a quick look at performance improvements and error handling.
Please let me know if you found this blog post useful!
Merry Christmas!
Resources
c3-chart-maker: https://github.com/codecapers/c3-chart-maker
Nightmare: https://www.npmjs.com/package/nightmare
C3: http://c3js.org